Visualizing the Ramayana as a Knowledge Graph
This blog explores how Anansi can be used to build knowledge graphs. The Ramayana, a timeless epic filled with rich characters and relationships, became the perfect source for extracting schemas and visualizing these connections in an interactive way.
About the Ramayana
The Ramayana is one of the great ancient Indian epics. It tells the story of Lord Rama, his wife Sita, his loyal brother Lakshmana, and his battle against the demon king Ravana. The Ramayana teaches lessons about duty, loyalty, courage, and the triumph of good over evil.
Throughout the epic, numerous characters play vital roles, each connected through intricate relationships and alliances that shape the story's unfolding events.
What is a Knowledge Graph?
A knowledge graph is a structured representation of real-world entities and their relationships, visualized as a network of nodes (entities) connected by edges (relationships).
A knowledge graph is built on three key concepts: entities, relationships, and graph structure. Entities represent real-world objects like people, places, or organizations. Relationships show how these entities are connected, such as "SON_OF or "KINGDOM_OF" The data is structured as a graph, with entities as nodes and relationships as edges.
Why Use a Knowledge Graph for the Ramayana?
The Ramayana is a complex story, filled with many characters, places, and events that are all connected in various ways.
Understanding these connections fully can be difficult when reading the text, but a Knowledge Graph helps make these relationships visible and easy to explore.
For example:
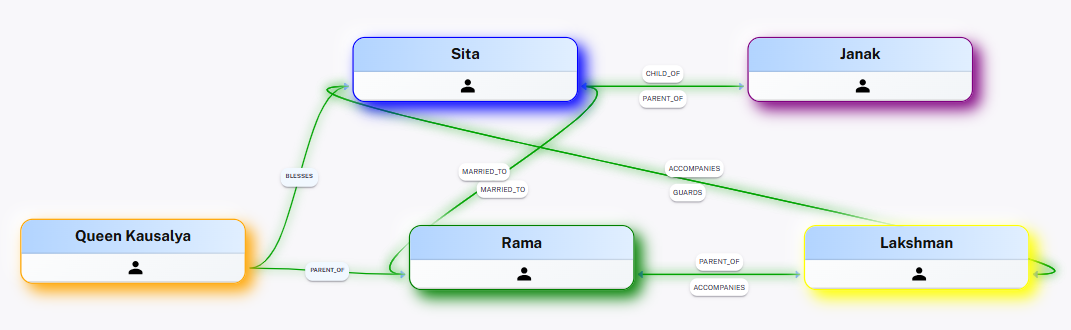
- You can clearly see how Rama is connected to Sita and Lakshmana.
- You can explore family trees, alliances, and battles.
This visual format makes it much easier for anyone — even without in-depth knowledge — to understand the story and its characters at a glance.
What is the Anansi Tool?
Anansi is a Visual Data Lineage Tool built on top of the Neo4j Graph Database. It helps you visualize how your data is connected. It allows you to understand and manage complex relationships, customize views, and work effortlessly with large data sets.
When dealing with large sets of interconnected information — like the Ramayana — A Knowledge Graph is the perfect tool to make sense of it all.
How did we create a Knowledge Graph for Ramayana
Schema Extraction
We use carefully crafted prompts with OpenAI’s language models to automatically extract nodes, properties, and relationships directly from the Ramayana PDF, enabling the system to understand and structure the text into a meaningful schema.
Schema extraction involves identifying:
- Nodes: Important characters such as Rama, Sita, and Lakshmana.
- Properties: Details about each node, like age, role, location, or unique characteristics.
- Relationships: Connections between the nodes, such as husband, brother, enemy, or friend.
This extraction process carefully reads the PDF and identifies these elements, building the foundation for the knowledge graph.
Organizing and Cleaning the Data
After extraction, the next step is to organize and standardize the data. In this step, we:
- Group similar entities under common categories for consistency. For example, all human characters (Ex: Rama, Lakshmana, Seetha) are grouped under the type Person.
- Remove duplicates and apply consistent naming conventions to ensure data integrity.
Once the data is organized, we upload it to Anansi using the Anansi SDK. From there, users can easily review, edit, or delete entries within Anansi as needed.
Final Schema Construction
Using the organized dataset, we crafted specific prompts to guide OpenAI’s language model in mapping the extracted nodes, properties, and relationships to the final schema.
Once this schema was finalized, we uploaded it to Anansi, where users can now interact with and visualize the knowledge graph by selecting relevant nodes and exploring their connections.
Why This Approach Works
By using this method, we can turn the Ramayana into an easy-to-navigate Knowledge Graph. This makes it much simpler to:
- Explore character relationships
- Visualize storylines
- Understand how everything is connected
Even for general readers without a technical background, the graph provides a clear, interactive view of the epic.
Final Output: Visualizing in Anansi
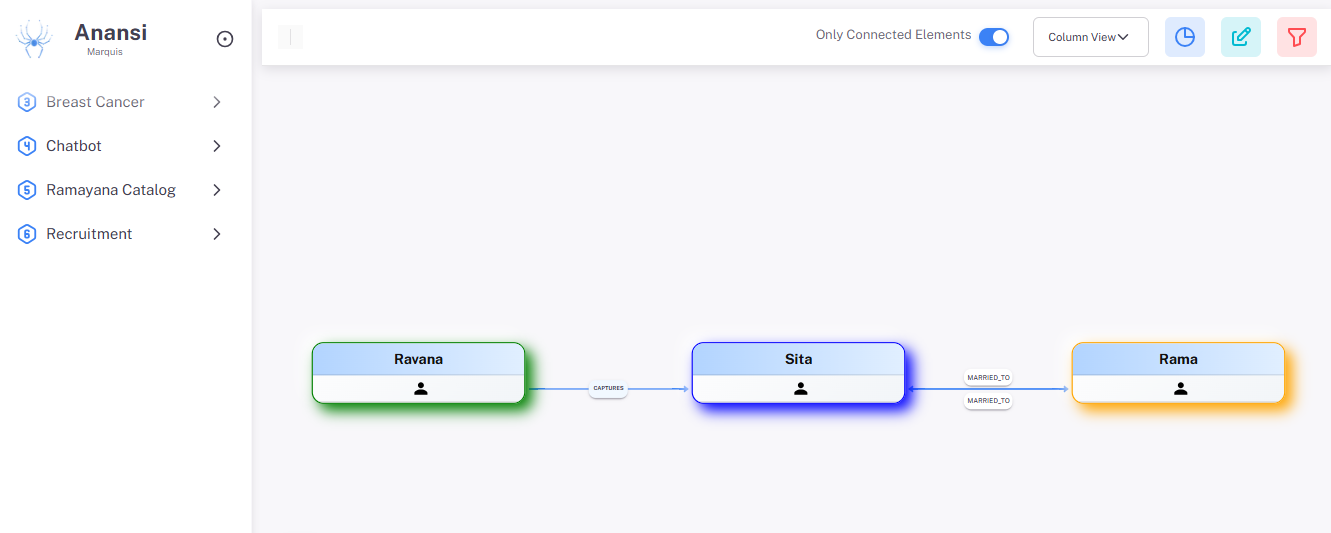
Once the process is complete, the knowledge graph can be easily visualized and explored through Anansi’s intuitive interface.
Conclusion
Using Anansi, we’ve turned the complex story of the Ramayana into a clear, interactive knowledge graph. This approach makes it easy to explore characters, relationships, and storylines in a simple, visual way. It’s a powerful method to bring ancient stories to life and make them accessible to everyone.